
In-silico works on the control of blood glucose level for different Type 1 Diabetes Mellitus Subjects using improved Hovorka equations
2Industrial Process Reliability and Sustainability Research Group (INPRES), Universiti Teknologi MARA (UiTM), Malaysia
3Paediatric Department, Universiti Teknologi MARA (UiTM), Malaysia
*Corresponding Author:
Received: 01-Jun-2022, Manuscript No. ajdm-22-51967; Accepted Date: Jun 27, 2022 ; Editor assigned: 03-Jun-2022, Pre QC No. ajdm-22-51967 (PQ); Reviewed: 17-Jun-2022, QC No. ajdm-22-51967; Revised: 22-Jun-2022, Manuscript No. ajdm-22-51967 (R); Published: 29-Jun-2022, DOI: 10.54931/2053-4787.30-6-2
Abstract
Background: One of the most common types of diabetes is Type 1 Diabetes Mellitus (T1DM) which causes high or low blood glucose levels (BGL) in a patient’s body. T1DM patients need to maintain their BGL in a safe glycemic range which is between 4.0 mmol/L to 7 mmol/L. Thus, it is high time to find the optimum insulin infusion rate into the patient’s body in achieving prolonged normoglycemic range.
Methods: Previous workers had focused on employing the improved Hovorka equations via in-silico study using one T1DM patient’s data; however, in-silico works employing more actual patients’ data are yet to be explored. Hence, this study attempts to apply the improved Hovorka equations on three different T1DM subjects so as to simulate their BGL profiles based on daily stipulated meal disturbances, individual body weights and age group.
Results: Results showed that the optimum insulin infusion rates required to regulate the BGL within safe glycemic range were at 0.1 U/min, 0.05 U/min and 0.0167 U/min for the case of patients 1, 2 and 3, respectively; provided that different amounts of meal intake (DG) were observed by each patient during breakfast, lunch and dinner times.
Conclusion: In conclusion, this study had proven that the improved Hovorka equations can be used to simulate the meal disturbance effect on BGL for more T1DM patients.
Keywords
Blood glucose level; Closed-loop control system; Hovorka model; Meal disturbance; Type 1 diabetes mellitus
Introduction
One of the most devastating diseases that one can experience is diabetes. It is considered one of the leading causes of death globally. Young people are more prone to developing diabetes as they get older. There are various types of diabetes, such as type 1 diabetes mellitus (T1DM), gestational diabetes, and type 2 diabetes mellitus. The consequences of these diseases can be divided into two categories namely, microvascular and macrovascular diseases.1 Blood glucose level is the level that the body can maintain at a desired level also known as glycemic index. It can range from 4 mmol/L-7 mmol/L. Hyperglycemia occurs when the BGL levels reach or exceed 7 mmol/L while hypoglycemia occurs when the BGL falls below 4 mmol/L with the signs of excessive perspiring, weariness, and light headedness.2 Artificial Pancreas (AP) is an innovative device that helps T1DM patients manage their blood glucose levels which mimics the role of existing endocrine system of normal pancreas. It is a closed loop control of blood glucose concentration which features a continuous subcutaneous insulin infusion (CSII) pump, a continuous glucose monitor (CGM), CGM receiver and control algorithm. These features help to maintain the proper flow rate and quantity of insulin so as to maintain the BGL within the normoglycemic range.3-5 Figure 1 shows the schematic diagram of AP.
Figure 1. Schematic Diagram of Artificial Pancreas (AP).
The control system is a crucial component of diabetes management. It plays a major role in controlling blood sugar levels and is often used to reduce or increase the insulin infusion rate. There are various control systems available for this study to evaluate various aspects of programming. Out of the various control systems, the Model Predictive Control (MPC) is the most widely used for controlling blood glucose levels in patients with T1DM. Its capabilities are numerous and can be utilized for various conditions.6 It is used for the prediction or programming of the correct dosage of insulin, the insulin infusion rate and the BGL for T1DM patients.10 Moreover, it is one of the control algorithms that are familiar to be used with the UVA/Padova and Hovorka models. Its reliability and ability to estimate the outcome data make it a good choice for In-silico or clinical study.7 Although the AP device can work seamlessly with MPC, it still cannot resist the limitations that arise due to its nature and limitations. These include the fluctuating BGL and insulin sensitivity towards different patients which can affect the diagnosis and treatment of diabetes.8
The relationship between the blood glucose concentration and the insulin response can be described by the Hovorka model that is made up of glucose subsystem, insulin subsystem and insulin action subsystem. The various subsystems in the body play key roles in the regulation of blood glucose. They are responsible for the administration of glucose and insulin, as well as the absorption and digestion of the nutrients.9 Despite the interactions between them are fully utilized in the model, their accuracy is not fully assessed which demands a modification.10 Simulations made by previous workers showed that the steady state plasma insulin concentration profile can be maintained at a fast rate using the improved Hovorka equations. In addition, the time delay of insulin delivery caused by the use of subcutaneous insulin injection method was observed in the improved equations of Hovorka model. It is suggested that the use of MPC with improved Hovorka equations can prevent this issue.11
Hence, the main objective of this study is to develop a customized computer algorithm that can simulate the BGL of patients with T1DM during their meal intakes using the improved Hovorka equations via MATLAB and MPC. The action is taken to find the optimum insulin infusion rate into the patient’s body for the BGL to be maintained at a safe glycemic range (4.0 mmol/L to 7.0 mmol/L). Besides, determination and comparison of BGL profiles versus time for all three T1DM subjects in achieving safe glycemic range is also one of the objectives for this study. Lastly, the limitations of the study are that the equations are only based on the improved Hovorka equations and are not applicable to variations in blood glucose level due to lifestyle factors.
Methods
The simulation work involves the use of improved Hovorka equations that are derived from the original Hovorka model to control the BGL for T1DM patients. Various original mathematical equations had been improved by performing system identification techniques.12 The difference after alteration of Hovorka model into improved Hovorka model can be seen in Figures 2 and 3, respectively.
Figure 2. Flow diagram of Hovorka model.
Figure 3. Flow diagram of Hovorka model with improved equations.
As can be seen in Figure 2, there is absent of complete interaction between the insulin action subsystem (represented as I) with glucose mass compartment (represented as G). The glucose in the accessible compartment (Q1) only interacts with two out of three subsystems available: insulin on action transport and insulin on endogenous production (x1 and x3). Meanwhile, glucose mass in the non-accessible compartment (Q2) also experiences the same situation by only having the interaction with two of the subsystems: insulin on action transport and insulin on action disposal (x1 and x2). By using the system identification technique to modify the Hovorka equations, all the insulin action subsystems are completely interacted with the glucose mass compartments. As depicted in Figure 3, insulin on action transport (x1), insulin on action disposal (x2) and insulin on endogenous production (x3) are completely interacted with glucose mass in accessible compartment (Q1) and glucose mass in non-accessible compartment (Q2).13
The glucose subsystem consists of the glucose mass in accessible and non-accessible compartments, and is modified with the addition of all insulin action (I) variables, which can be signified from the equations (1) to (5):
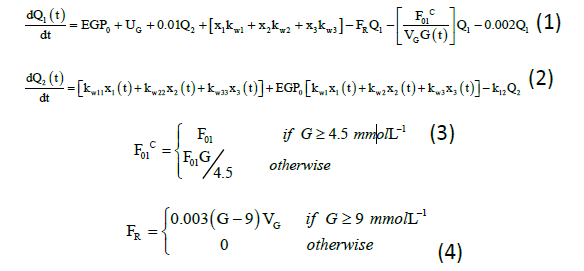
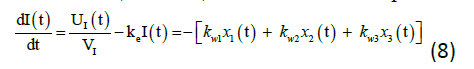
Q1(t) and Q2(t) (mmol) denote the mass of glucose in accessible and non-accessible compartments, respectively. kw1, kw11, kw2, kw22, kw3, and kw33 (min−1) denote the transfer rate of insulin action subsystem, while k12 (min−1) denotes the transfer rate constant from the non-accessible compartment to accessible compartment.14 EGP0 (mmol/min) denotes the endogenous glucose production (EGP) extrapolated to zero insulin concentration, and UG (mmol/min) denotes the gut absorption rate.7 Equation for meal disturbances is represented by equation (5):
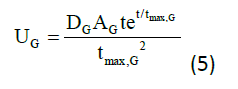
Where,
DG =amount of carbohydrate (CHO) digested (mmol)
AG =carbohydrate bioavailability
tmax, G =time to maximum of CHO absorption (min)
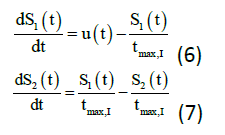
The following equations (6) to (7) denote the insulin subsystem that is remained unchanged from the Hovorka equations. The insulin sensitivity in the accessible and non-accessible compartments represents as S1 and S2 while the time to maximum of insulin absorption as tmax, I (min). There are few new variables, which are added to the plasma insulin concentration equations namely: ke (min-1) is the elimination rate, V1 (L) is the insulin distribution volume, and UI (mU/min) is the insulin absorption rate.
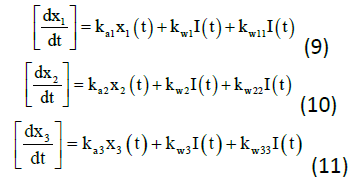
The insulin action subsystem equations consist of action transport, action disposal and endogenous production (x1, x2, and x3) while the constant for deactivation and activation rates of insulin action (ka1, ka2, ka3, kw1, kw11, kw2, kw22, kw3, and kw33) represents the equations (9) to (11).
Constants and parameters involved in the equations are shown in the Tables 1 and 2.
| Symbol | Constant | Value and Unit |
|---|---|---|
| k12 | Transfer rate from non-accessible to accessible compartment | 0.066 min−1 |
| ka1 | Deactivation rate of glucose | 0.006 min−1 |
| ka2 | Deactivation rate of glucose | 0.06 min−1 |
| ka3 | Deactivation rate of glucose | 0.03 min−1 |
| kw1 | Activation rate of glucose | 50.1 min−1 |
| kw11 | Activation rate of glucose | -10.0 min−1 |
| kw2 | Activation rate of glucose | 50.1 min−1 |
| kw22 | Activation rate of glucose | -0.01 min−1 |
| Symbol | Parameter | Value and Unit |
|---|---|---|
| EGP0 | EGP extrapolated to zero insulin concentration | 0.0161 mmolkg−1min−1 |
| F01 | Non-insulin-dependent glucose flux | 0.0097 mmolkg−1min−1 |
| tmax,I | Time-to-maximum of absorption of subcutaneously injected short-acting insulin | 55 min |
The simulation work was performed based on the estimated meal disturbances on the T1DM patients.15 Table 3 shows the estimated amount of daily meals intake that focuses on carbohydrates (CHO) intake, whereas Table 4 shows the demographic profile of the patients. The meal was divided into three types: breakfast, lunch, and dinner. 16 The amounts of insulin administered (Ut) selected for this study were namely: 0.100 U/min for high dosages, 0.050 U/min for medium dosage and 0.0167 U/min for low dosage. The simulation work using improved Hovorka equations was done in MATLAB and data obtained were then collected for further analysis and evaluation.
| Patient | Meal | Time (hours) | ||
|---|---|---|---|---|
| 730 (Breakfast) | 1330 (Lunch) | 1900 (Dinner) | ||
| 1 | g CHO | 48 | 88 | 10 |
| mmol CHO | 1654.08 | 3032.48 | 344.6 | |
| 2 | g CHO | 72.2 | 28 | 86 |
| mmol CHO | 2488.11 | 964.92 | 2963.68 | |
| 3 | g CHO | 75 | 1.4 | 45 |
| mmol CHO | 2584.6 | 48.25 | 1550.76 | |
| Patient | Gender | Age (years) | Body Weight(kg) | Height (cm) | Body Mass Index, BMI (kg/m2) |
|---|---|---|---|---|---|
| 1 | Male | 13 | 27 | 135 | 15 |
| 2 | Female | 11 | 26.3 | 133.02 | 15 |
| 3 | Male | 14 | 49.9 | 159.99 | 20 |
Results and Discussion
Meal simulation for patient 1
The meal disturbance effect during meals time namely: breakfast, lunch and dinner were studied by acquiring the graph of BGL versus time of each patient.17 The BGL was affected by the amount of meal intake, DG by patients and also by the action of administered insulin, Ut. (Figure 4).
Figure 4. Blood glucose level versus time for patient.
As shown in Figure 4, the patient 1 had consumed 48 g CHO, 88 g CHO and 10 g CHO during breakfast (t=150 min to t=180 min), lunch (t=510 min to t=540 min), and dinner (t=840 min to t=870 min), respectively. The insulin (Ut) was administered earlier at t=0 min with 0.1 U/min to ensure less time delays. The insulin action time delay can cause BGL to increase too high and uncontrollable. It can be seen in Figure 4 that the BGL was above the normoglycemic range (4 mmo/L to 7 mmol/L) initially and started to decrease until breakfast meal. During breakfast (t=150 min to t=180 min) the BGL became high which was at 9.9 (mmol/L). Once breakfast was finished, the BGL was back to normal at 4.7 mmol/L. The highest point of BGL level was during lunch (t=510 min to t=540 min) at 11.2 mmol/L at time, t=600 min and came back to normal even during dinner (t=840 min to t=870 min) due to lower consumption of meal as compared to during earlier meal time that made the BGL remained in safe glycemic range.
Meal simulation for patient 2
From Figure 5, the initial point of BGL for patient 2 was exactly the same as patient 1 due to unstable BGL before breakfast, although the amount of insulin administered (Ut) was not the same, which was 0.05 U/ min (medium dosage) at t=0. During the meal time, it showed that the spike of BGL was occurred drastically until exceeded 10 mmol/L at time, t=180 min for breakfast (72.2g CHO) and dinner (86 g CHO) except for lunch (28g CHO) which was at 7.2 mmol/L at time, t=540 min. All the BGL were back to stable range when the Ut was pumped at the rate of 0.05 U/ min after 1 minute for each of the meal time.
Figure 5. Blood glucose level versus time for patient.
Meal simulation for patient 3
As shown in Figure 6, the BGL versus time only had an obvious change in value during breakfast (t=150 min to t=180 min) and dinner (t=840 min to t=870 min). The BGL during breakfast (75g CHO) was increased to 10.8 mmol/L at time, t=180 min and during dinner (45g CHO) was increased at 9 mmol/L at time, t=870 min.18 Prior to that, the Ut was pumped at the rate of 0.0167 U/min at time 151 min after breakfast while 181 min after dinner. The BGL came back to safe glycemic range after the insulin was administered. There was no significant changed of BGL during lunch (t=510 min to t=540 min) due to patient 3 only consumed small amount of meal which was 1.40g CHO. The amount of CHO consumed during this meal did not contribute to hyperglycemia or hypoglycemia episodes for the patient (constant BGL) (Figure 7).
Figure 6. Blood glucose level versus time for patient.
Figure 7. Blood glucose level versus time for patients 1, 2 and 3.
Figure 7 depicts the blood glucose level versus time for all patients involved in this study. It can be seen that all the BGL were dropped to the normoglycemic range (4 to 7 mmol/L) as the insulin was administered after breakfast, lunch and dinner times.19 The BGL for all patients during each meal time were compared with the previous work 2 which used improved Hovorka equations for simulation using MATLAB. From their works, the BGL after food consumed during breakfast was at 46.81 mmol/L compared to this study which was at 9.9 mmol/L, 10.7 mmol/L and 10.8 mmol/L for patients 1, 2 and 3, respectively. The difference of BGL after breakfast time was bigger compared to the previous work because in their study, the BGL before breakfast time was at 15.3 mmol/L and that was higher than the average value of BGL in this study which was at 8 mmol/L.20 Moreover, the same outcome produced when the insulin administered after the lunch time from the previous work 2 and this study succeeded in decreasing the BGL to reach the normoglycemic range before dinner time. The result for BGL during dinner time was again cross-referenced with the previous work 2. Based on their findings, the BGL after dinner was 48.97 mmol/L as compared to the highest BGL for this study which was patient 2 at 11.9 mmol/L. The patients in both studies experienced change of BGL from hyperglycemic range to normoglycemic range. From this study, the insulin action for the improved Hovorka equations was reacted at a fast rate to normalise the BGL because of the enhancement in glucose insulin dynamic interrelations as compared to the other study that used original Hovorka equations.17
In this study, each patient was administered with different dosages of insulin, Ut: 0.1 U/min for patient 1, 0.05 U/min for patient 2 and 0.0167 U/min for patient 3. Even though the patient consumed a high total amount of meal, it did not require high dosage of Ut to be administered to reduce the BGL into safe glycemic range.21 As an example, patient 2 that consumed the highest total amount of meal which was 186.20 g CHO only required Ut of 0.05 U/min to regulate the BGL. Furthermore, there were none hyperglycemia or hypoglycemia episodes experienced by the patients after the insulin was administered except right after the meal disturbance. This study had proven that the selected dosage of Ut was the optimum insulin infusion rate into the patients’ body for the BGL to be maintained at a safe glycemic range (4.0 to 7.0 mmol/L).
Conclusion
Based on this study, it had shown that the same amount of insulin could be administered after each meal time for each patient. This study had verified that the improved Hovorka equations could be used to simulate the meal disturbance effect on blood glucose level of T1DM. Besides, the optimum insulin infusion rates into the patient’s body to regulate the BGL between 4 to 7 mmol/L were at 0.1 U/min, 0.05 U/min and 0.0167 U/min for the case of patients 1, 2 and 3, respectively. Furthermore, the simulation for BGL to be in normoglycemic range can be incorporated with other factors such as stress and daily exercise in future works so as to get more proven results.
Acknowledgment
The authors wish to acknowledge and extend their gratitude to the Ministry of Higher Education, Malaysia and Research Management Centre, UiTM for the financial support given under Grant No: 600-RMC/ GPK 5/3 (222/2020). The authors would also like to thank the School of Chemical Engineering, College of Engineering, UiTM and the Paediatric Department, Faculty of Medicine, UiTM for all the support and assistance rendered. The authors sincerely acknowledge the participation of T1DM patients in this research project.
Author Disclosure Statement
Nur Amanina Mohd Sohadi and Muhammad Faris Johari conducted the programming works. Ayub Md Som, Noor Shafina Mohd Nor, Sherif Abdulbari Ali and Mohd Aizad Ahmad analysed the data and supervised the overall research works. Nur Amanina Mohd Sohadi, Ayub Md Som and Muhammad Faris Johari wrote the paper. All authors have no conflict of interest.
Funding Details
This research received no specific grant from any funding agency in the public, commercial, or not for profit sectors
Conflict of Interests
The authors declare that there is no conflict of interest.
References
- Khan RMM, Chua ZJY, Tan JC, et al. From pre-diabetes to diabetes: Diagnosis, treatments and translational research. Med. 2019; 3(2):126.
[Crossref] [Google Scholar] [PubMed]
- Som AM, Yusof NFM, Ali SA, et al. Meal disturbance effect on blood glucose control for type 1 diabetes using improved Hovorka equations. Key Eng Mater. 2019;797:158-167.
- Hajizadeh I, Turksoy K, Cengiz E, et al. Real-time estimation of plasma insulin concentration using continuous subcutaneous glucose measurements in people with type 1 diabetes. Proc Am Control Conf Res. 2017; 5193-5198.
[Crossref] [Google Scholar] [PubMed]
- Zavitsanou S, Mantalaris A, Georgiadis MC, et al. In-silico closed-loop control validation studies for optimal insulin delivery in type 1 diabetes. IEEE Trans Biomed Eng. 2015; 62(10):2369-2378.
[Crossref] [Google Scholar] [PubMed]
- Som AM, Yusof NFM, Ali SA, et al. In-Silico works on the control of blood glucose level for Type 1 Diabetes Mellitus ( T1DM ) Using improved hovorka equations. Int J Pharm Med Biol Sci. 2020; 9(4):144-151.
- Liu W, Jin H. Risk analysis of a closed-loop artificial pancreas based on generalized predictive control. Proc. 2020 5th Int Conf Comput Intell Appl ICCIA. 2020: 156-160.
[Crossref] [Google Scholar] [PubMed]
- Hovorka R, Cononico V, Chassin LJ, et al. Nonlinear model predictive control of glucose concentration in subjects with type 1 diabetes. Physiol Meas. 2004; 25(4): 905-920.
- Yusof NFM, Som AM, Ali SA, et al. Simulation work for the control of blood glucose level in type 1 diabetes using hovorka equations. Adv Mater Res. 2015; 1113: 739-744.
- Kovatchev B. Control to range for diabetes: Functionality and modular architecture. J Diabetes Sci Technol. 2018; 3(5): 1058-1065.
- Ngo PD, Wei S, Holubová A, et al. Reinforcement-learning optimal control for type-1 diabetes. IEEE EMBS Int Conf Biomed Heal Informatics, BHI. 2021;2018: 333-336.
- Lee JB, Dassau E, Gondhalekar R, et al. Enhanced model predictive control (eMPC) strategy for automated glucose control. Ind Eng Chem Res. 2016; 55(46): 11857-11868.
- Rahman MS, Alam MS, Tanvir MU, et al. Effects of renal clearance, gut absorption, plasma insulin and independent glucose flux on glucose concentration of human body. 4th Int Conf Electr Eng Inf Commun Technol. 2019: 330-335.
- Turksoy K, Samadi S, Feng J, et al. (2016) Meal detection in patients with type 1 diabetes: A new module for the multivariable adaptive artificial pancreas control system. IEEE J Biomed Heal Informatics. 2016;20(1): 47-54
- Boiroux D, Mahmoudi Z, Jorgensen JB. Parameter estimation in type 1 diabetes models for model-based control applications. Proc Am Control Conf. 2019;2019: 4112-4117.
- Som AM, Yusof NFM, Ali SA, et al. Simulation work on blood glucose control for type 1 diabetes using modified hovorka equations. 2019; 27(4): 1527-1538.
[Crossref] [Google Scholar] [PubMed]
- Yusof NFM, Som AM, Ibrehem AS, et al. Parameter Addition in Interaction of Glucose and Insulin for Type 1 Diabetes. IEEE EMBS Conference on Biomedical Engineering and Sciences. 2012;2012: 273-278.
- Daud NAM, Mahmud F, Jabbar MH. Meal simulation in glucose-insulin reaction analysis using Hovorka model towards system-on-chip implementation. ARPN J Eng Appl Sci. 2015; 10(19): 8927-8935.
- Sohadi NAM, Som AM, Nor NSM, et al. Control of blood glucose level for Type 1 Diabetes Mellitus (T1DM) using improved hovorka equations: Comparison between clinical and in-Silico Works. Afri J Dia Med. 2020;29(1): 1-11.
- Yusof NFM, Som AM, Ibrehem AS, et al. Determination of knowledge of caregivers about dietary practices of autistic children. J Appl Sci. 2014; 14(13): 1465-1468.
- Yusof NFM, Som AM, Ibrehem AS, et al. System identification in modified diabetic model for nanochip controller. Adv Mater Res. 2014;938: 299-304.
- Yusof NFM, Som AM, Ali SA, et al. Meal disturbance effect on control of blood glucose level for critically-ill patients using in-silico works. IOP Conference Series: Materials Science and Engineering. 2020;358: 012043
Select your language of interest to view the total content in your interested language
Latest issues
To read the issue click on a cover